Taking a Closer Look at 2019 for 2020
- Jan 15, 2020
- 3 min read
Updated: Jan 15, 2020
For a streamlined market update for all of Alameda, San Francisco, and Contra Costa Counties, click here.

THE MARKET IS SHIFTING, BUT THE SKY ISN'T FALLING
With many people's only experience with a slowing/slowed market being the great recession, I hear worries that the correction we're entering will mirror what was. That's nowhere close to what's happening. Prices, for the most part, haven't decreased. Growth is slowing, but for the areas I researched overall values have continued to rise.
OAKLAND

Oakland as a whole has experienced an average growth rate of 3% annually since 2015. But in 2019, that rate slowed to just under 1%.
While the median number of days a home was on the market stayed consistent at 12, the average days Oakland homes took to sell was 22 -- up by one day from 2018.
The holidays may not be the best time of year for a deal. The first quarter of the year often demonstrates the lowest sales prices of the year, and sometimes even lower than the previous year's last quarter (aka the holidays).
Sales prices are highest during the second quarter (aka the spring market), so if you're thinking of selling, now is the time to get started.
If you're thinking of buying, history shows you'll have the most options and some of the year's best prices in the fall (third quarter). However, I caution you against trying to time the market. My best advice to anyone looking to buy is this:
If you find a house you love and can afford to buy it, buy it. Don't wait.

HOW YOUR NEIGHBORHOOD AFFECTS YOUR VALUE
Flat growth was not the story for many of Oakland's top neighborhoods. I ran data for 12 neighborhoods (Glenview, Oakmore, Crocker Highlands/Trestle Glen, Temescal, Rockridge, Upper Rockridge, Montclair, Lincoln Heights/Highlands, Maxwell Park, the Laurel, the Dimond, and Redwood Heights) and here are the highlights:
TEMESCAL experienced the highest growth rate of 11% appreciation in 2019, and has averaged 10% annually since 2015 (also the highest). Somewhat surprisingly, it's not in the top 3 of most competitive neighborhoods, but winning bids still come in 28% over the list price. The median sales price here is $1,322,000 and the number of sales in this coveted area has gone down consistently over the past 5 years. The demand is clearly there, but with shortening supply, the numbers should continue to rise.
GLENVIEW is also maintaining strong, even increasing, growth at 10%, up a point from 2018. Don't believe the list prices here, though. Second only to Oakmore, Glenview's winning bids average 31% over asking and topped out at 85% over asking for one property (yes, seriously). The number of sales here continues to increase, while the amount of time the homes stay on the market is getting shorter. Demand here is high!
OAKMORE is another top growth neighborhood for 2019 with 8% appreciation, but its growth rates have been a bit more erratic over the past five years so there's no reportable trend here, other than homes are typically priced way below market value (like in Glenview), so winning bid average a whopping 42% over the list price (with the highest over bid of the year coming in 81% over list).
ROCKRIDGE showed a surprising -2% dip in growth after a banner 2018 which had the strongest appreciation in five years. The only property to sell under $1,000,000 in Rockridge (and for more than 10% under asking price) was an Open Door listing (you've heard of ibuyers, right? It worked out well for the buyers (represented by a local Realtor), but the sellers seem underserved).
The DIMOND was this year's "best buy" neighborhood, though not great news for sellers here because prices dropped 5% in this normally fetching neighborhood. I'm going to venture this dip was an anomaly as the Dimond district has averaged a strong 6% growth rate since 2015. Homes still sold for 15% over asking price, though they tended to stay on the market slightly longer than the past couple years.
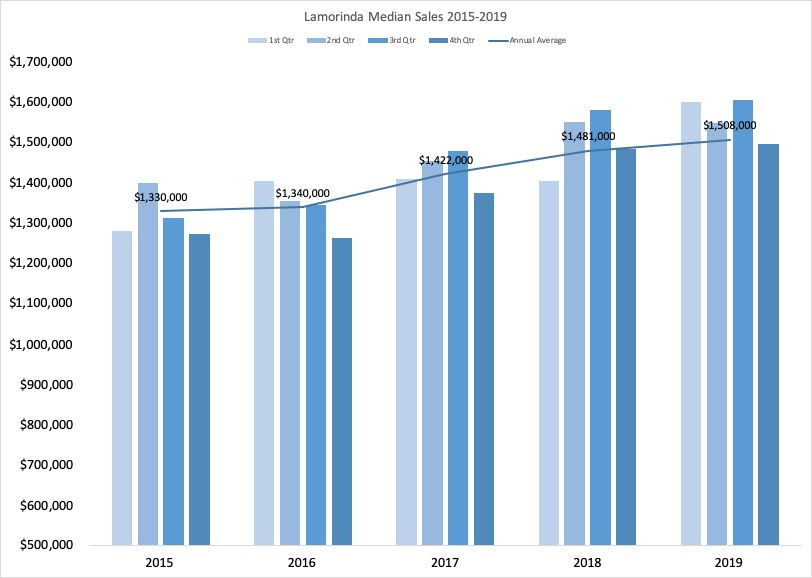
LAMORINDA

OVER THE HILLS AND THROUGH THE TUNNEL
Are you tired of the under-pricing game? Then there is light at the end of the tunnel. Literally. Go through the tunnel to Lamorinda (that's Lafayette, Moraga, and Orinda for you city folk) and you'll be amazed to find a mere ~2% differential between asking and selling prices. This is a benefit for buyers and sellers -- without the pricing game there's less anxiety for you sellers that a buyer won't offer the 20% over asking you need to get, and for you buyers, well, need I state the obvious? Prices here average higher than other East Bay cities, but with strong public schools and advantageous tax rates, the entry price can balance out. Curious? Let's talk.
Comments